Dashboard Templates
This page distributes Grafana dashboard templates available in MediaHarbor.
You can easily install dashboard templates from the downloaded JSON files and create dashboards linked with data sources.
Additionally, created dashboards can be registered as one of MediaHarbor's input video sources.
How to Import Templates
- Access the Grafana management screen from MediaHarbor's
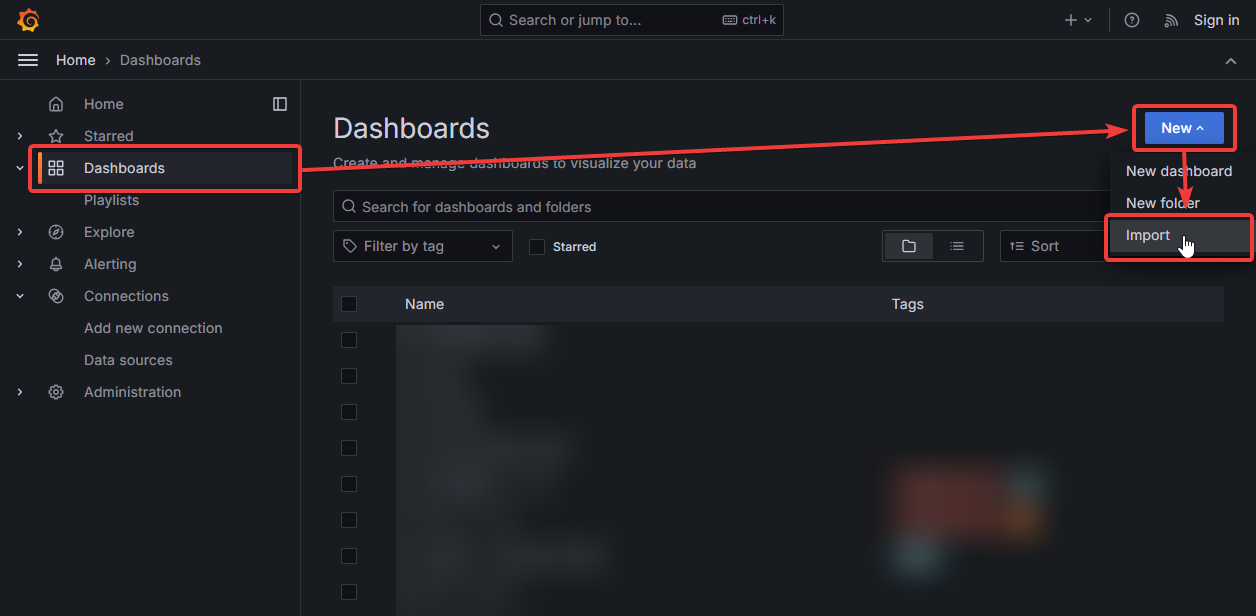
System Settings>Dashboard Settings. - Select
Dashboards>New>Importfrom the left menu.
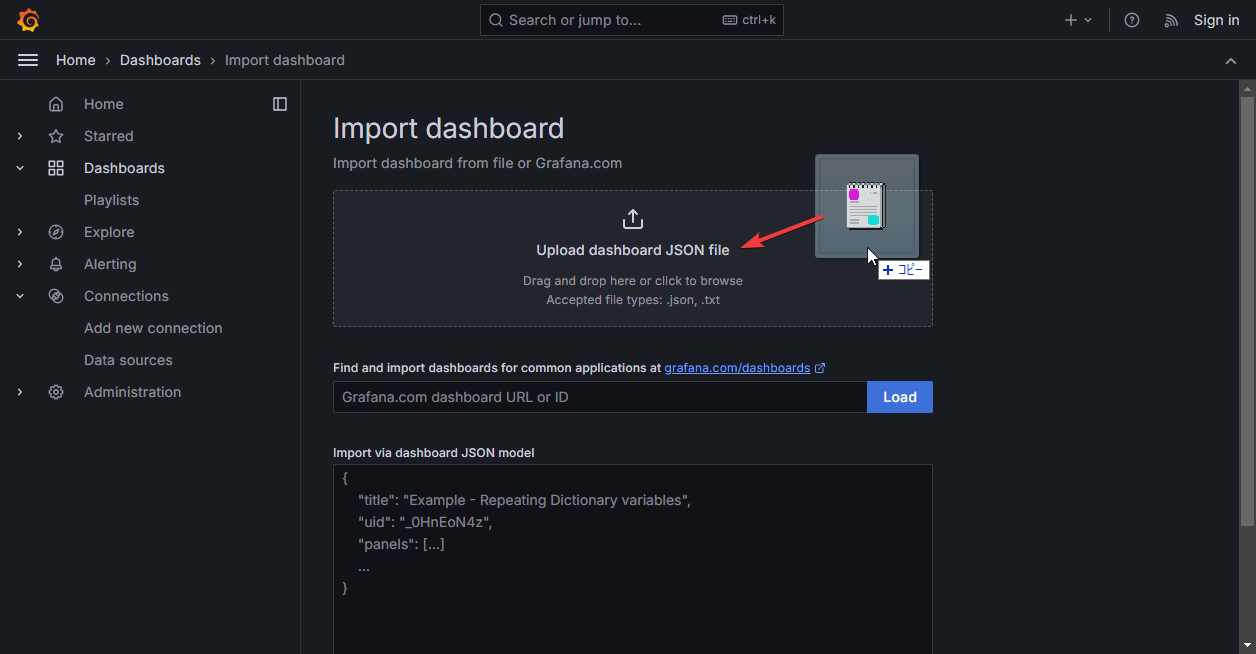
- Drop the downloaded template's JSON file.
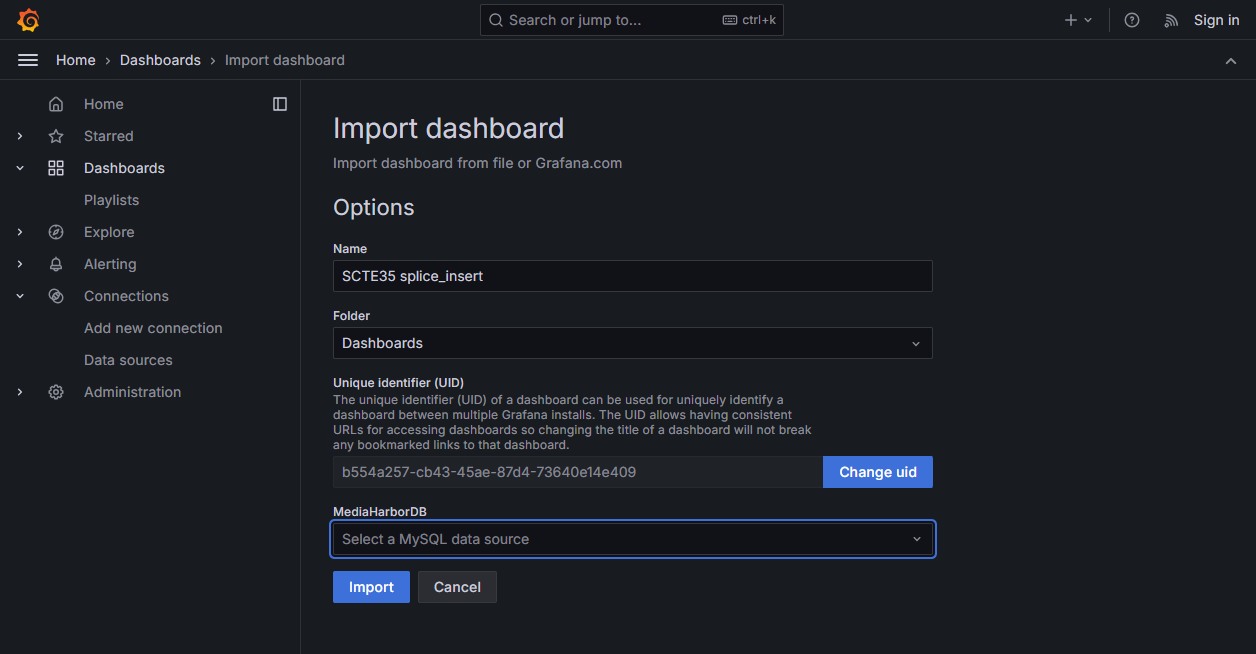
- Select the dashboard name and the data source to use, then click Import.
- For data source settings required for templates needing HACOBE-CLOUD integration, refer to HACOBE-CLOUD Data Source Settings.
HACOBE-CLOUD Data Source Settings
To properly operate HACOBE-CLOUD integrated dashboards, a CloudWatch data source is necessary.
- Access the Grafana management screen from
System Settings>Dashboard Settings. - Select
Connections>Data Sourcesfrom the left menu. - Click
Add new data sourceand add a CloudWatch data source. - Refer to the IAM Policy Sample below to generate an access key in the IAM of the AWS account where HACOBE-CLOUD is operating, and enter the AWS credentials.
- Enter
HACOBE_CLOUDinNamespaces of Custom Metrics. - Click
Save & Testand confirm the connection is successful.
For more details, refer to the official Grafana help site below.
IAM Policy Sample
1 2 3 4 5 6 7 8 9 10 11 12 13 14 15 16 17 18 19 20 21 22 23 24 25 26 27 28 29 30 | |
How to Specify the Target HACOBE-CLOUD in an Environment with More Than Two HACOBE-CLOUD Instances
Open the downloaded template JSON file in a text editor.
Use the find and replace function to change the value of each ec2_instance_id in the dimensions.
String to search for
1 | |
1 | |
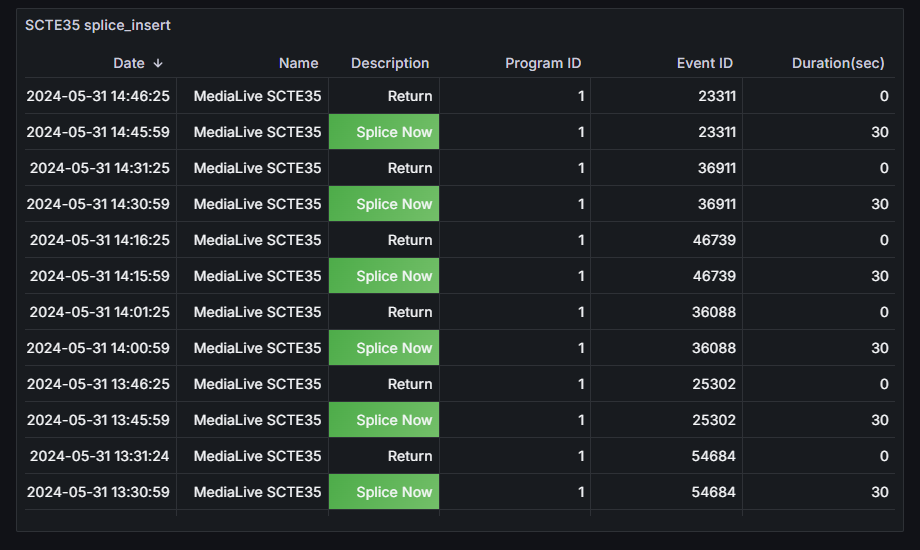
SCTE35 splice_insert Template
A dashboard displaying SCTE35's splice_insert in a tabular format.
Tip
This dashboard template is only available when SCTE35 analysis functionality is enabled.
To use the SCTE35 analysis functionality, you need to purchase SCTE35 analysis points (SCTEpt) and enable SCTE35 analysis settings.
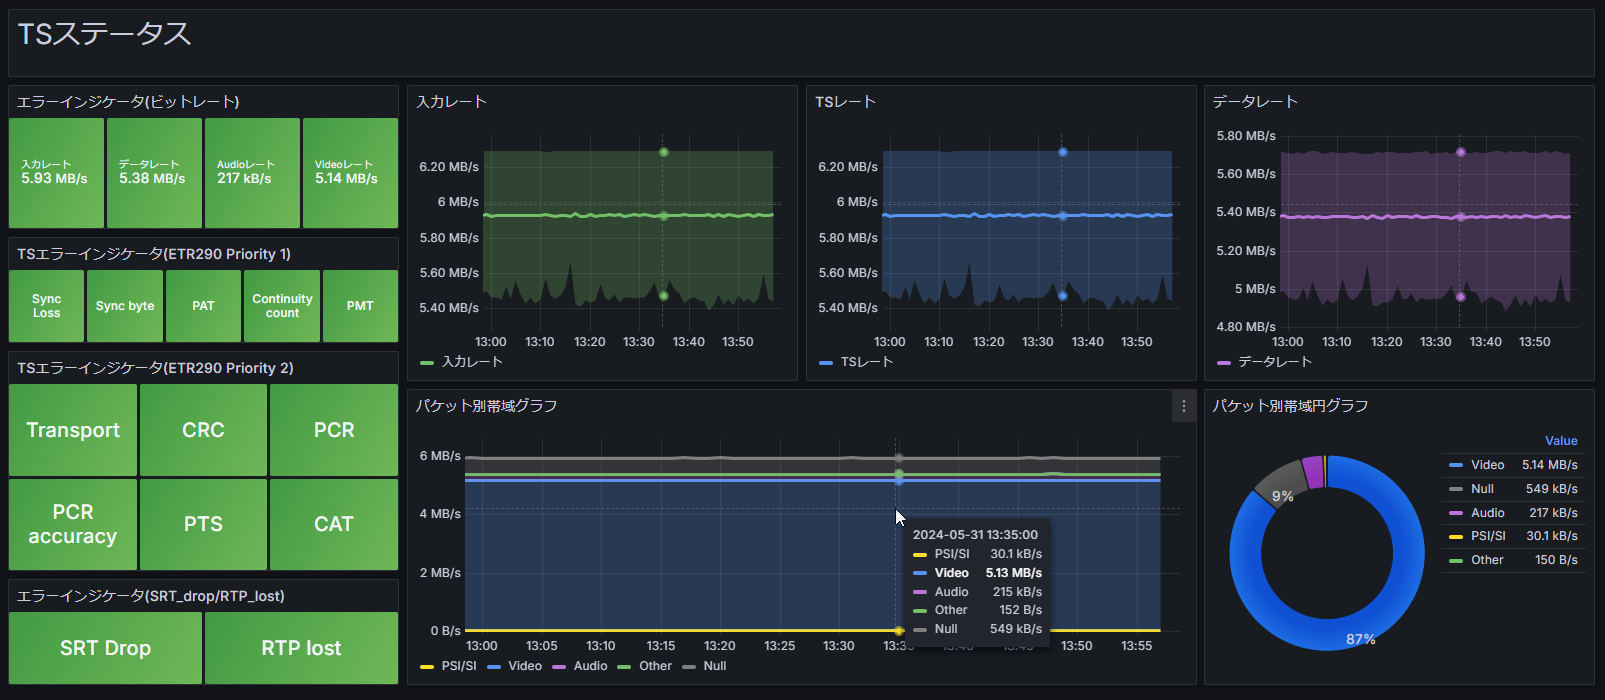
HACOBE-CLOUD TS Status Template
A dashboard displaying TS status metrics acquired from HACOBE-CLOUD.
Tip
This dashboard template requires HACOBE-CLOUD integration.


Refer to HACOBE-CLOUD Data Source Settings for the integration settings.
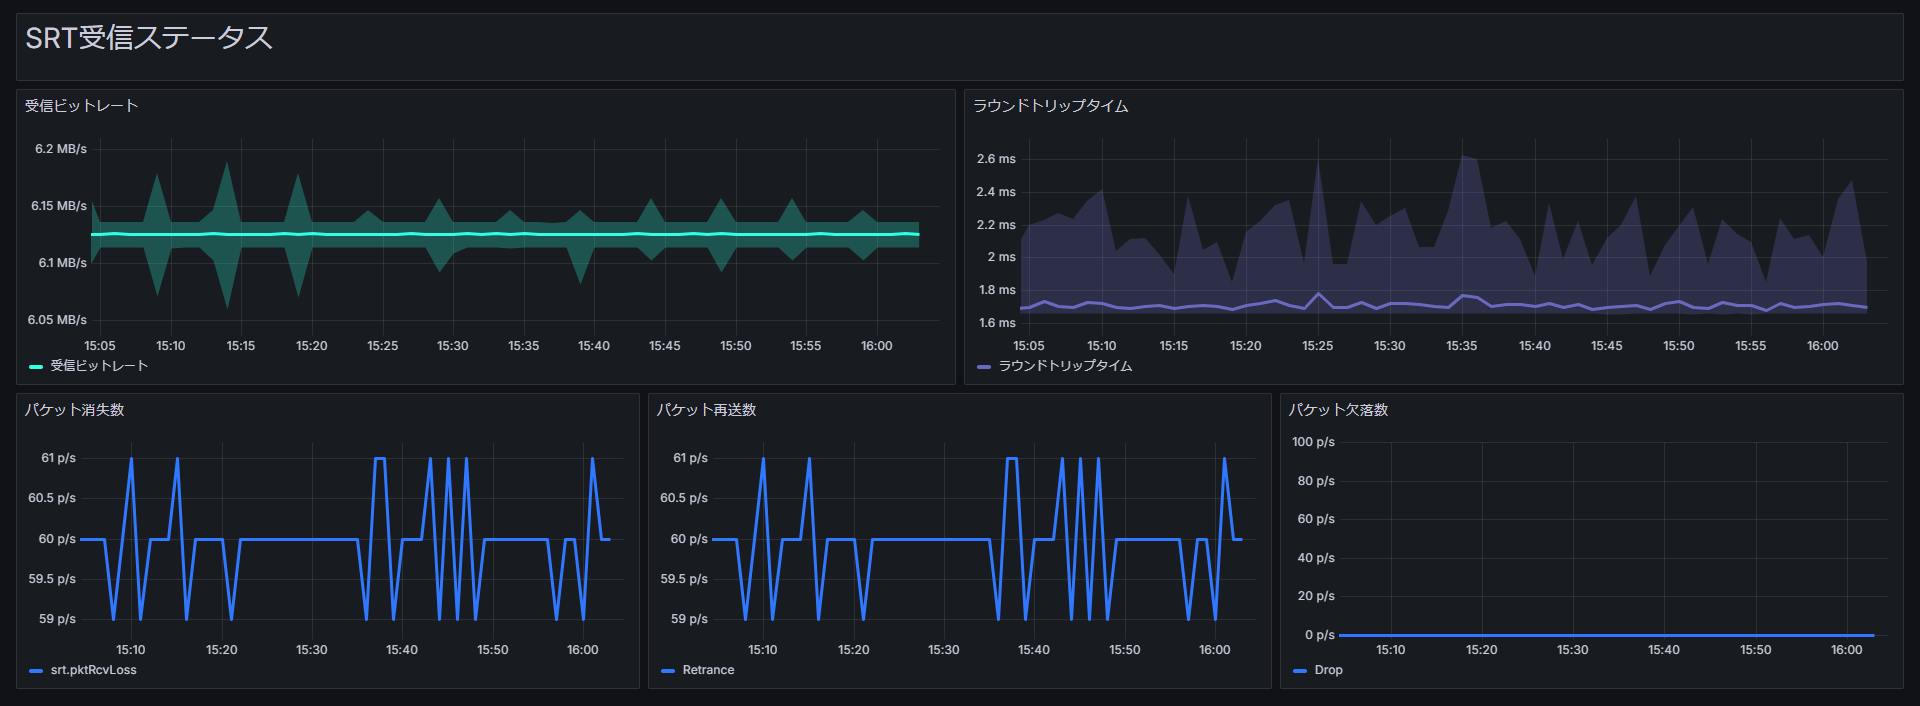
HACOBE-CLOUD SRT Reception Status Template
A dashboard displaying SRT reception status metrics acquired from HACOBE-CLOUD.
Tip
This dashboard template requires HACOBE-CLOUD integration.
Refer to HACOBE-CLOUD Data Source Settings for the integration settings.
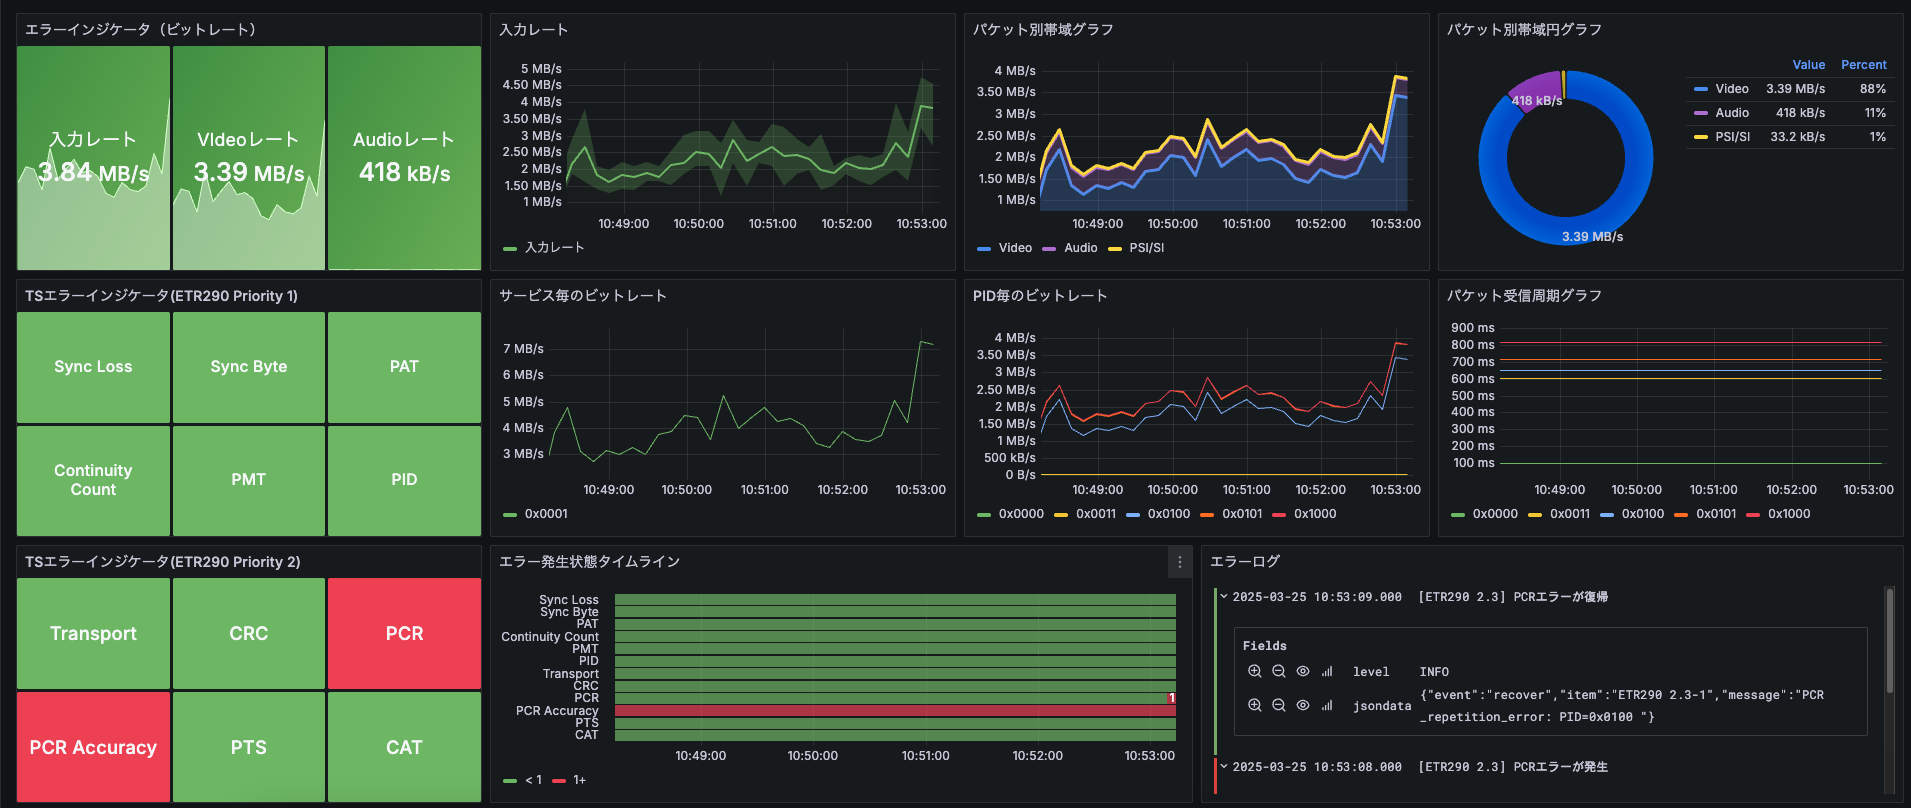
TS Monitoring Status Template
A dashboard that displays metrics for the TS monitoring status.
Tip
This dashboard template is only available when the TS monitoring feature is enabled.
To use the TS monitoring feature, you need to purchase TS Monitoring Points (TSMONpt) and enable TS monitoring in the settings.
How to Specify the Input Source
Open the downloaded template JSON file with a text editor.
Use the find-and-replace function to replace the following string with the ID of the input source you want to monitor.
String to Find
1 | |
1 | |
How to Check the Input Source ID
- You can check it on the Input Monitoring Settings screen.
- You can also right-click the source on the Edit Layout screen to copy the source ID.
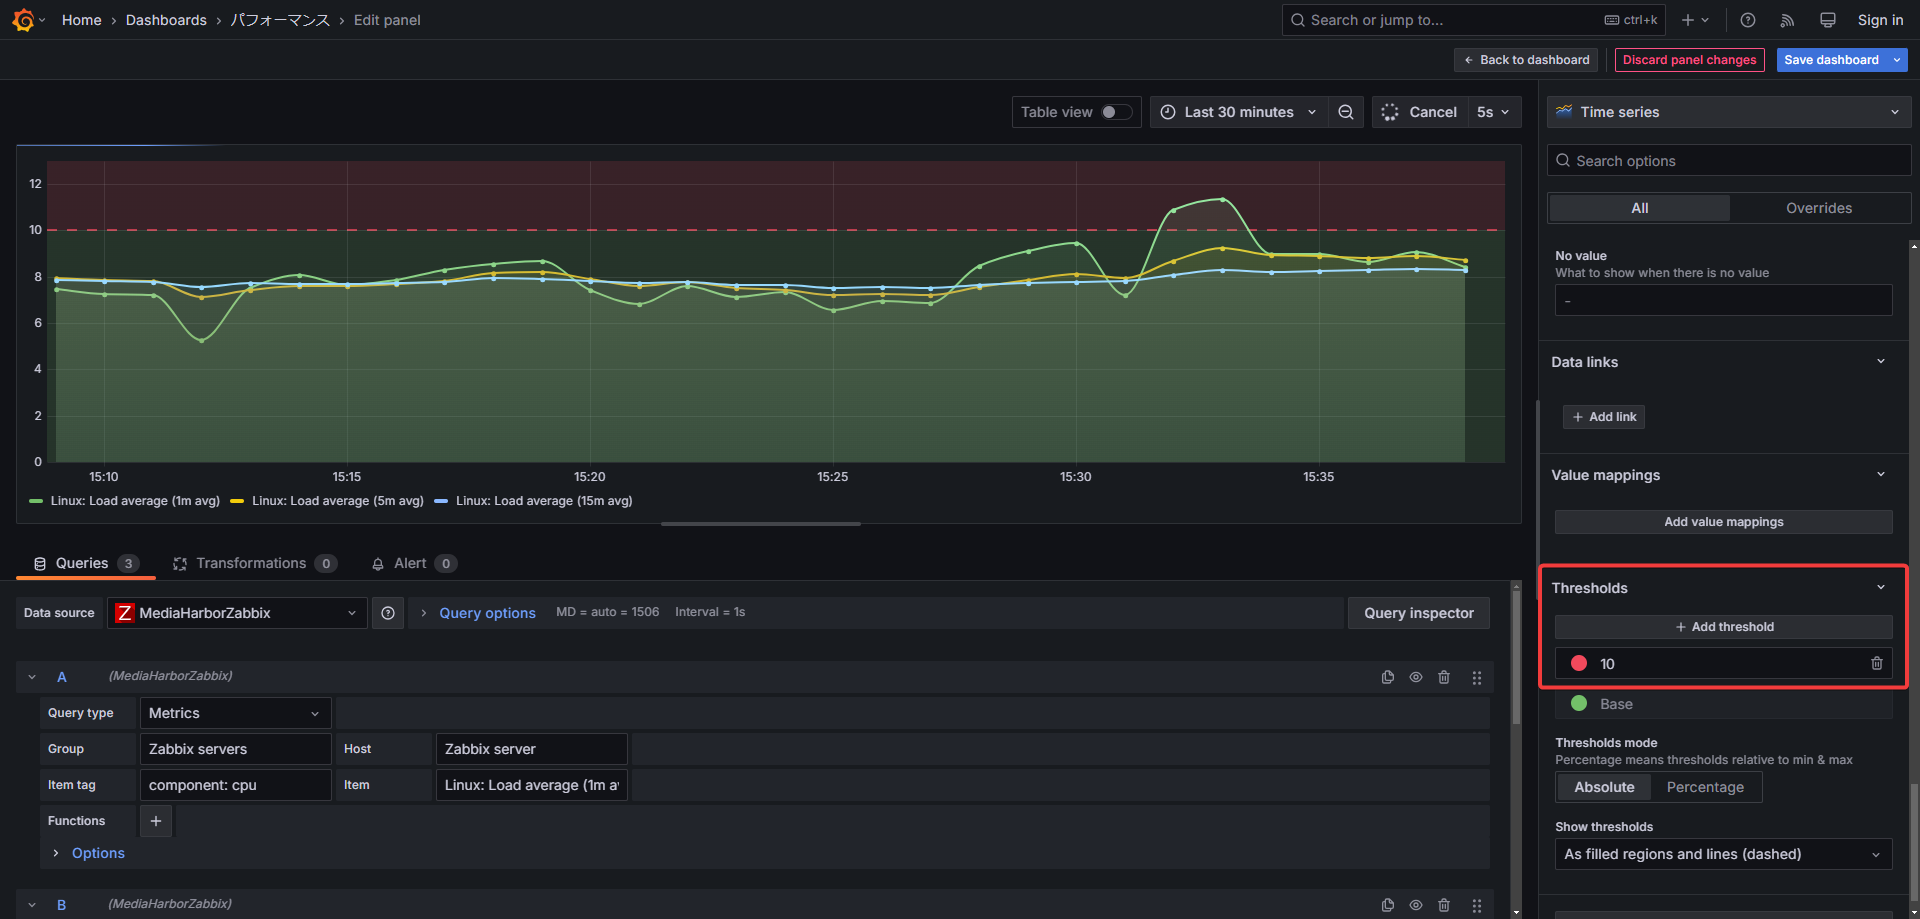
System Performance Template
A dashboard that displays system performance metrics.
It shows CPU usage, load average, and memory usage.
Note
When you perform a fresh installation of the latest version, it comes pre-installed.
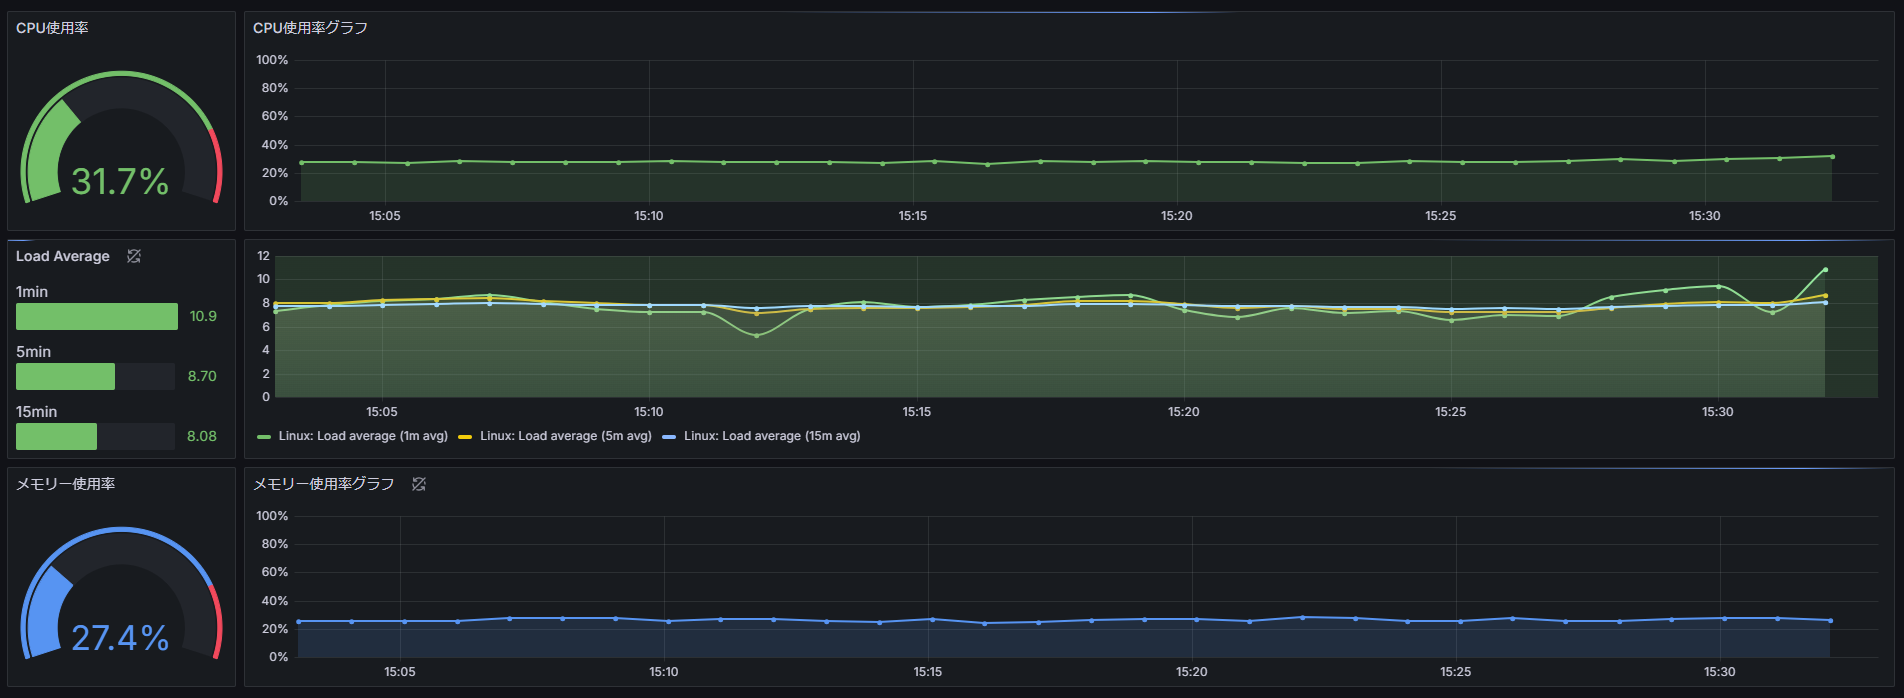
Tip
It is recommended to configure the Thresholds for Load Average according to the number of logical cores, as this makes the indicator easier to interpret.