TS monitoring status template
OfficialDashboard layout
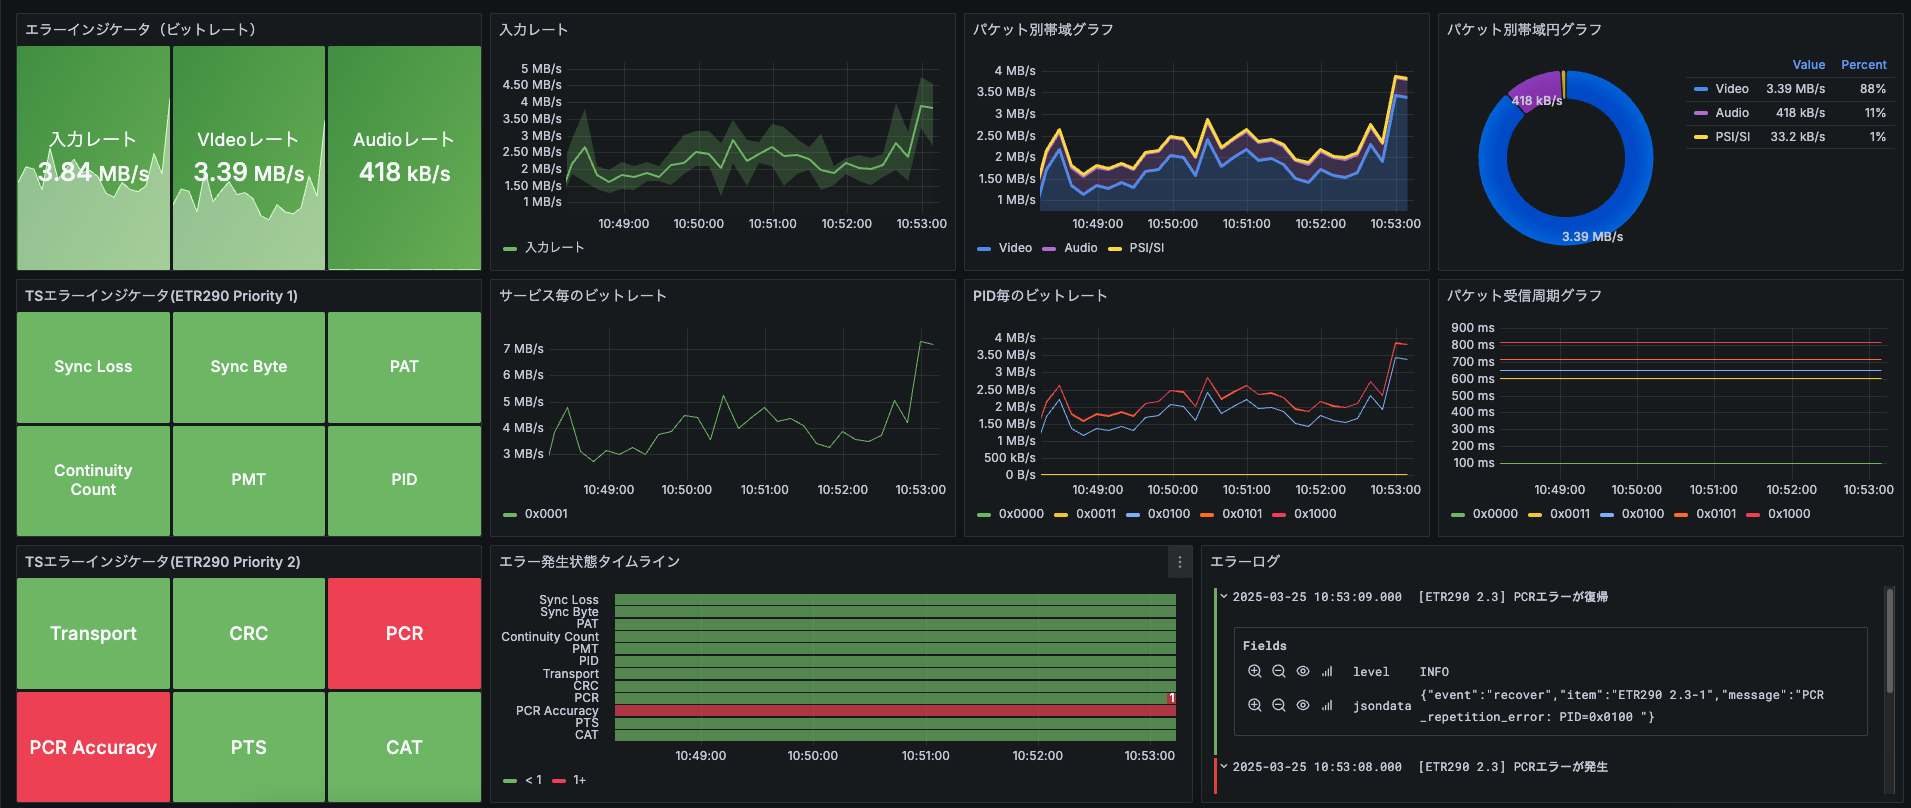
Dashboard for TS monitoring status metrics.
T
Traffic Sim Co., Ltd.
Tip
This template is only available when TS monitoring is enabled.
You need TS Monitoring Points (TSMONpt) and the appropriate settings.
Note Specifying the input source
Open the downloaded JSON in a text editor and replace the following string with your input source ID.
Find
{source_id}Replace with
01234567-89ab-cdef-0123-456789abcdefHow to find the input source ID
- Check the Input Monitoring Settings screen.
- Or right-click the source on the Edit Layout screen to copy the ID.
Grafana dashboard templates (shared instructions)
Download the JSON from the Download button at the top of this page.
Below are import steps for Grafana in MediaHarbor. For adding data sources or template-specific integration, follow the notes on each template page.
Note How to import templates
- Open the Grafana UI from MediaHarbor
System Settings>Dashboard Settings. - In the left menu, choose
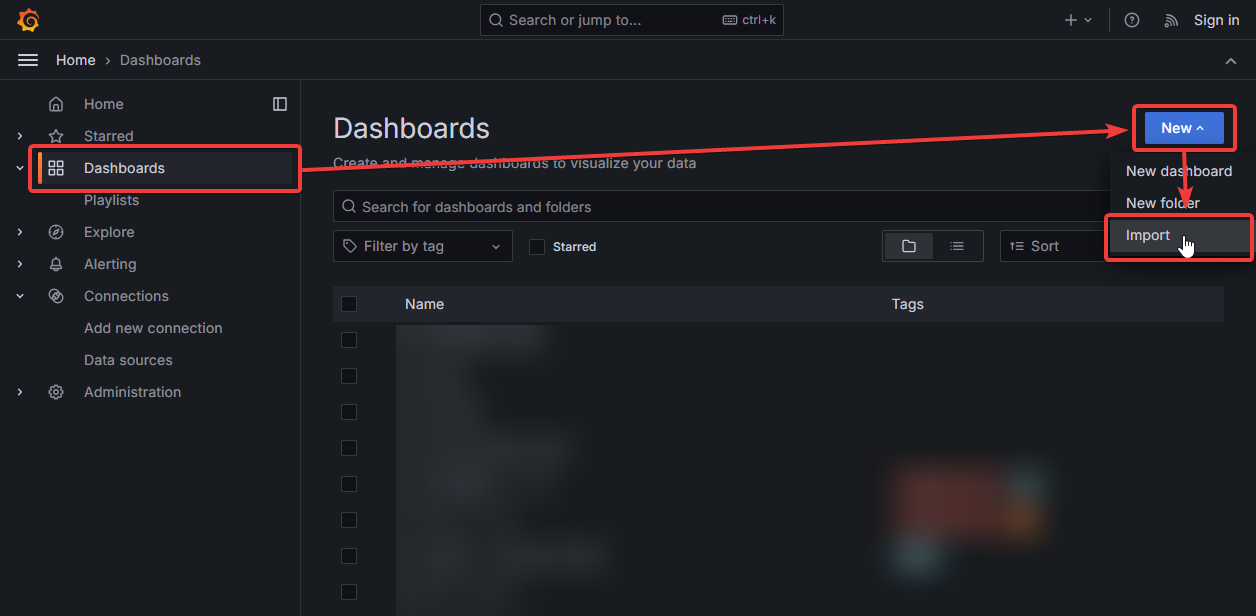
Dashboards>New>Import.
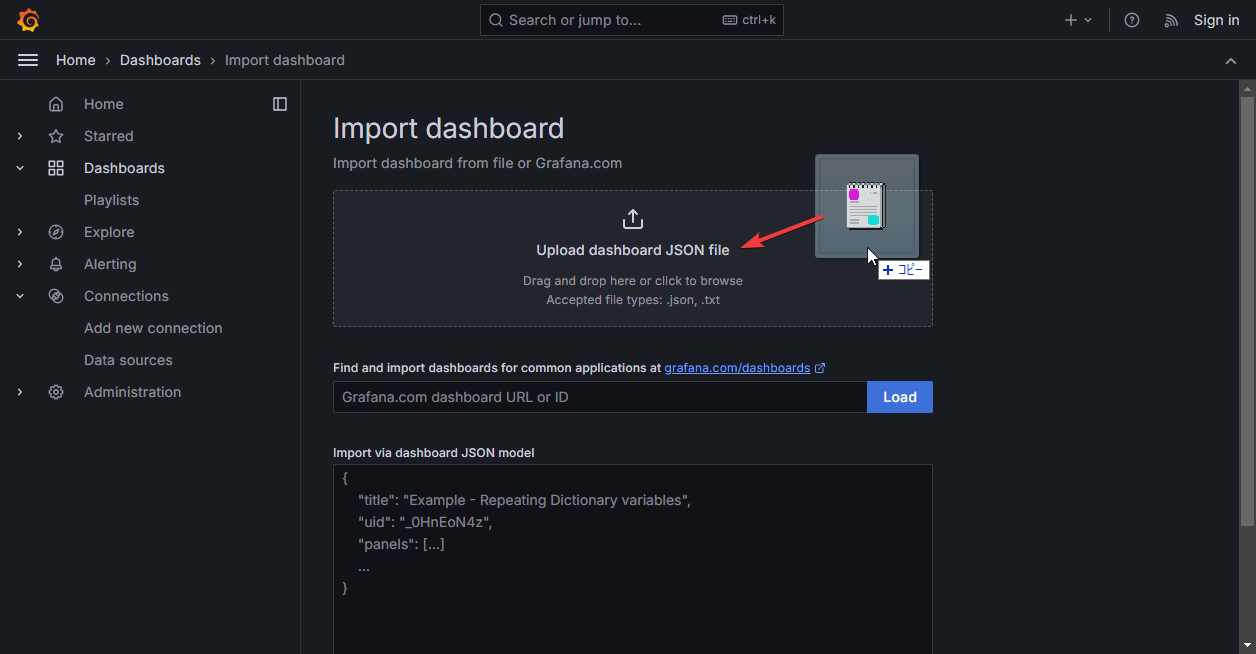
- Drop the downloaded template JSON file.
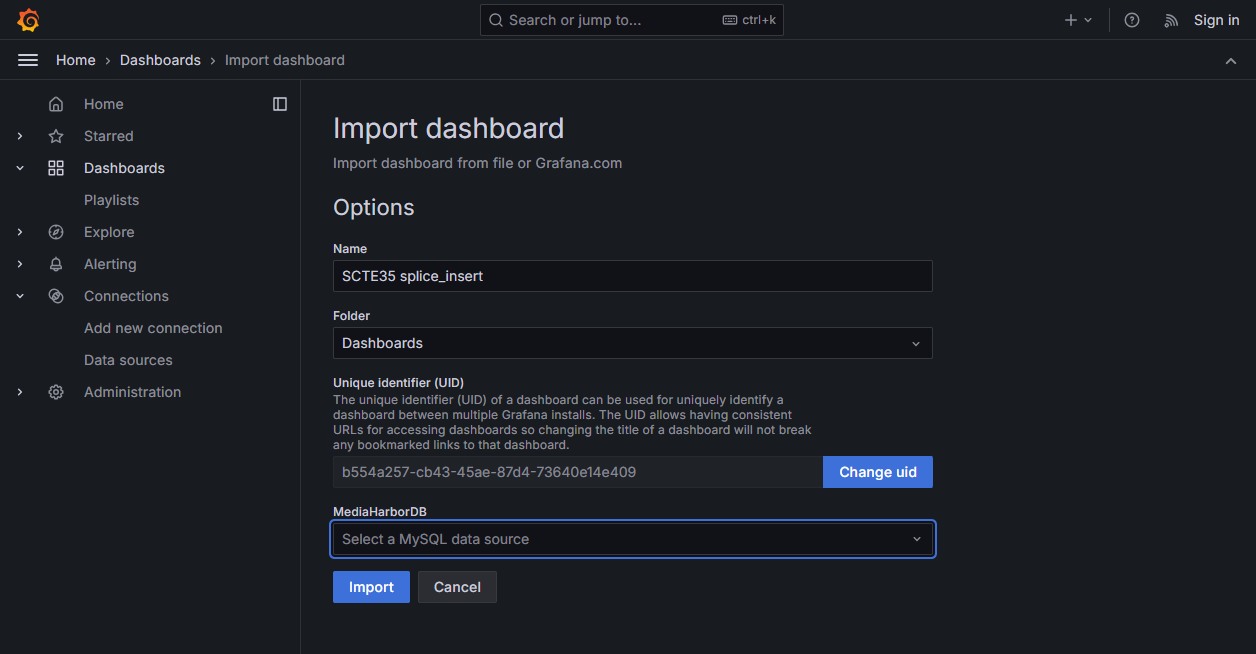
- Choose the dashboard name and data source, then click Import.
- After import, add or configure any required data sources as described on the template page.