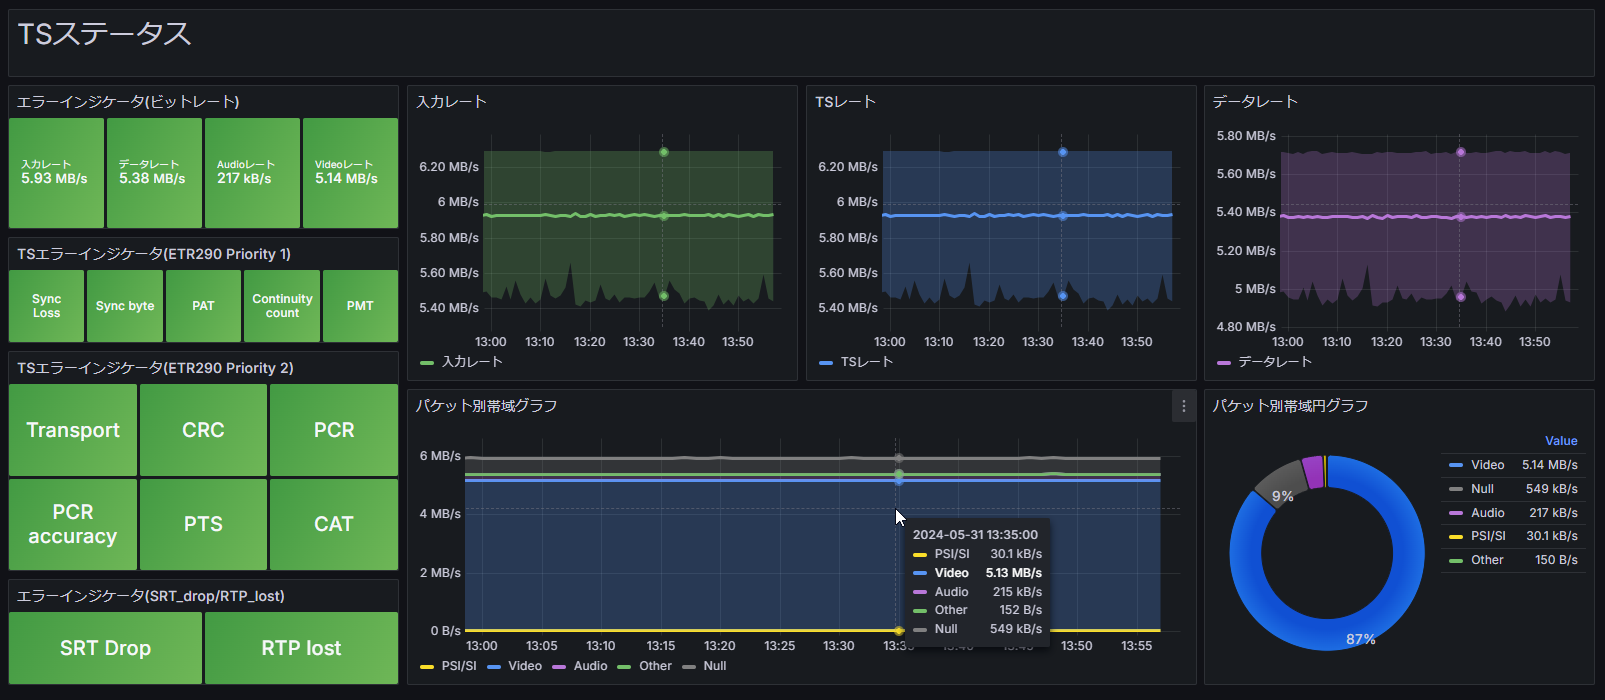
HACOBE-CLOUD TS status template
Dashboard for TS status metrics collected via HACOBE-CLOUD.
Tip
This template requires HACOBE-CLOUD integration.

Follow HACOBE-CLOUD data source settings and the sections below on this page.

HACOBE-CLOUD data source settings
To run HACOBE-CLOUD integrated dashboards, you need a CloudWatch data source.
- Open Grafana from
System Settings>Dashboard Settings. - In the left menu, choose
Connections>Data Sources. - Click
Add new data sourceand add CloudWatch. - Use the IAM policy sample below to create keys in the AWS account where HACOBE-CLOUD runs, and enter the AWS credentials.
- Set
Namespaces of Custom MetricstoHACOBE_CLOUD. - Click
Save & Testand confirm the connection succeeds.
For more detail, see the official Grafana documentation:
IAM policy sample
{
"Version": "2012-10-17",
"Statement": [
    {
    "Sid": "AllowReadingMetricsFromCloudWatch",
    "Effect": "Allow",
    "Action": [
        "cloudwatch:DescribeAlarmsForMetric",
        "cloudwatch:DescribeAlarmHistory",
        "cloudwatch:DescribeAlarms",
        "cloudwatch:ListMetrics",
        "cloudwatch:GetMetricData",
        "cloudwatch:GetInsightRuleReport"
    ],
    "Resource": "*"
    },
    {
    "Sid": "AllowReadingTagsInstancesRegionsFromEC2",
    "Effect": "Allow",
    "Action": ["ec2:DescribeTags", "ec2:DescribeInstances", "ec2:DescribeRegions"],
    "Resource": "*"
    },
    {
    "Sid": "AllowReadingResourcesForTags",
    "Effect": "Allow",
    "Action": "tag:GetResources",
    "Resource": "*"
    }
]
}
Targeting an instance when multiple HACOBE-CLOUD instances run
If more than one HACOBE-CLOUD instance is running, set each template’s ec2_instance_id in dimensions to the instance you want.
- Open the downloaded template JSON in a text editor.
- Use find and replace to change every
ec2_instance_idvalue insidedimensions.
Search for
"ec2_instance_id": "*"
Replace with
"ec2_instance_id": "i-xxxxxxxxxxxxxxxxx"
Use the EC2 instance ID of the HACOBE-CLOUD instance you want to monitor.
Grafana dashboard templates (shared instructions)
Download the JSON from the Download button at the top of this page.
Below are import steps for Grafana in MediaHarbor. For adding data sources or template-specific integration, follow the notes on each template page.
Note How to import templates
- Open the Grafana UI from MediaHarbor
System Settings>Dashboard Settings. - In the left menu, choose
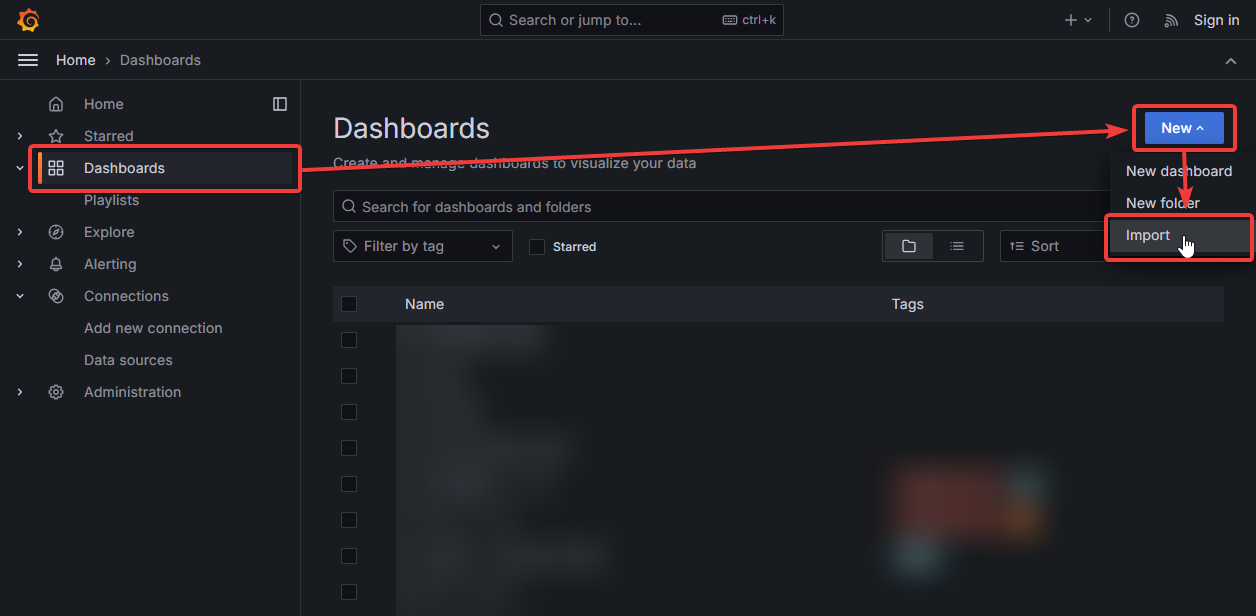
Dashboards>New>Import.
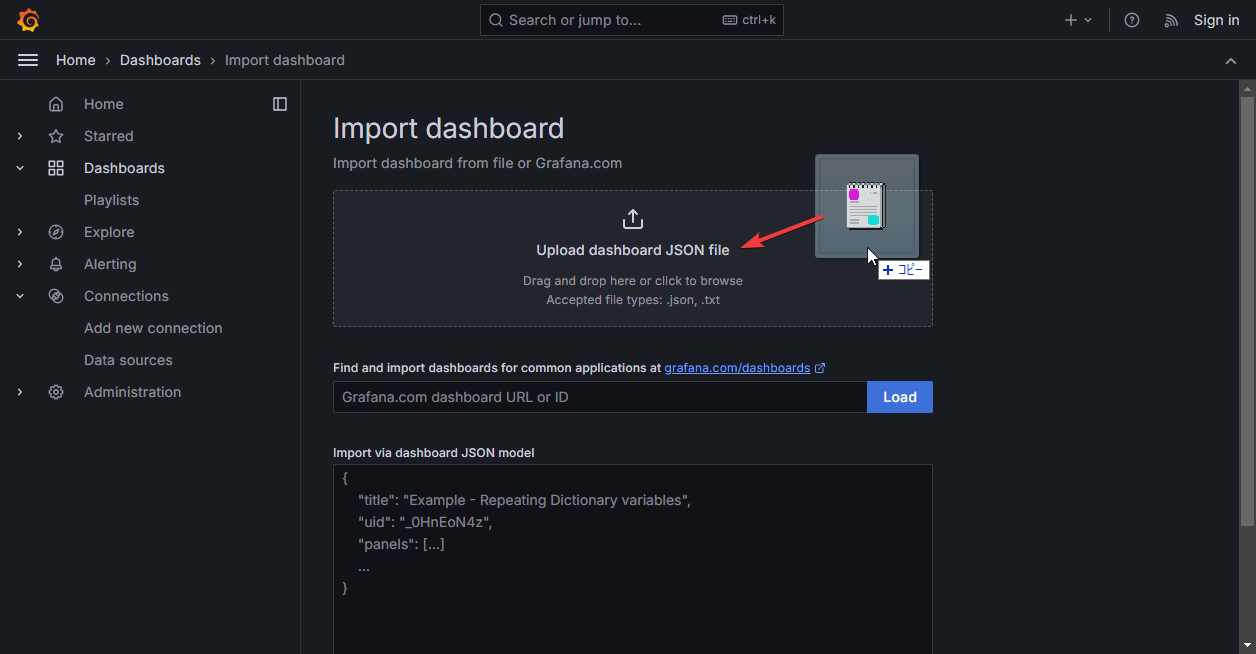
- Drop the downloaded template JSON file.
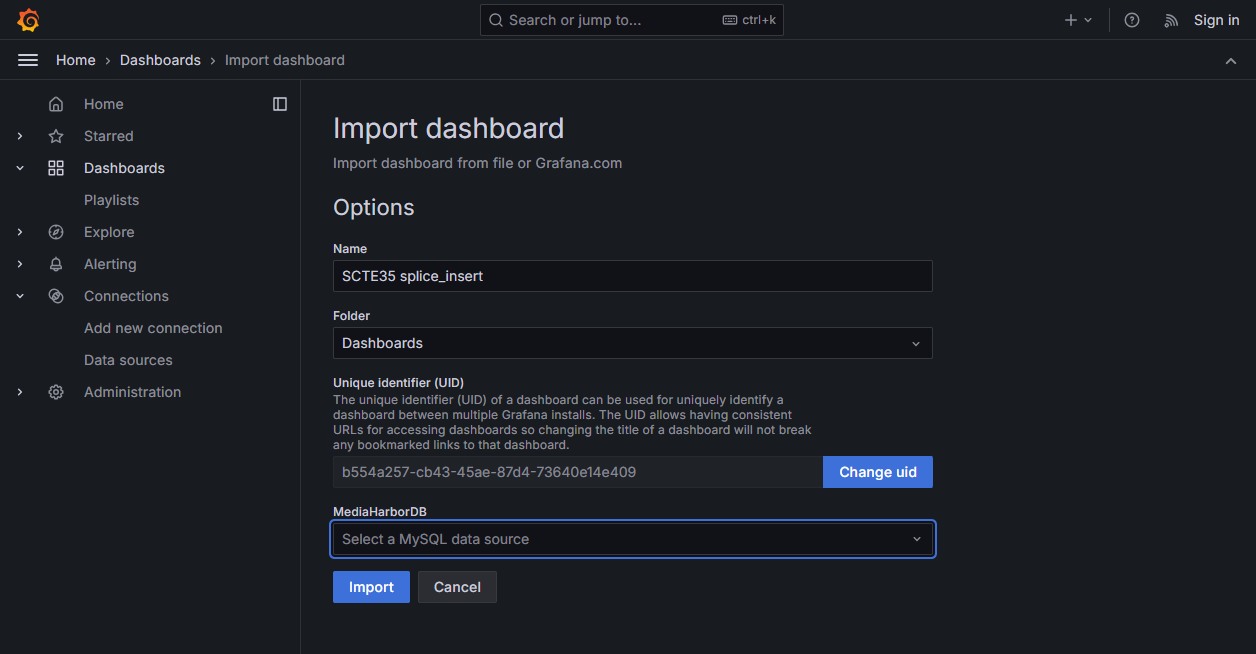
- Choose the dashboard name and data source, then click Import.
- After import, add or configure any required data sources as described on the template page.